$ export INGRESS_GATEWAY=$(oc get route -n istio-system istio-ingressgateway -o 'jsonpath={.spec.host}')
$ while : ; do curl http://${INGRESS_GATEWAY}/productpage ; sleep 1 ; doneVisualizing your Service Mesh
This document assumes that you installed Kiali as part of your installation. If not, please install the Kiali operator and update your SMCP before continuing.
Before you Begin
-
Install Maistra by following the instructions here.
-
Deploy Bookinfo application by following these instructions.
What is Kiali
Kiali is a component which visualises an application’s topology, health, metrics and tracing information to provide a deeper understanding of the application’s behavior and performance. Within a single view it is easy to determine which services are communicating with each other, where the traffic is flowing, information about the current health of the service and other useful metrics.
Kiali also integrates with Jaeger to provide access to distributed tracing information, allowing you to track an individual request as it flows through the system and identify potential issues.
How does Kiali work?
Every pod deployed as part of the Service Mesh contains a proxy container responsible for intercepting the application traffic coming into and going out of the pod. The Service Mesh proxy is automatically created on deployment of the application and automatically captures information as part of each service invocation. Kiali uses this information to provide a visualisation of the Service Mesh behavior. The information includes metrics as well as distributed tracing information.
Generating load
Before we take a look at the Kiali console lets first generate some load on the Service Mesh. From within a new terminal enter the following commands
Opening the Kiali console
To open the Kiali console enter the following command within a new terminal
$ xdg-open https://$(oc get route -n istio-system kiali -o 'jsonpath={.spec.host}')When prompted to login use your OpenShift credentials.
Kiali’s Graph
Within the Kiali UI select the Graph option from the navigation on the left and then
-
bookinfofrom theSelect a namespacedropdown -
Versioned app graph -
Requests percentagefrom theNo edge labelsdropdown -
Last 1m -
Every 10s
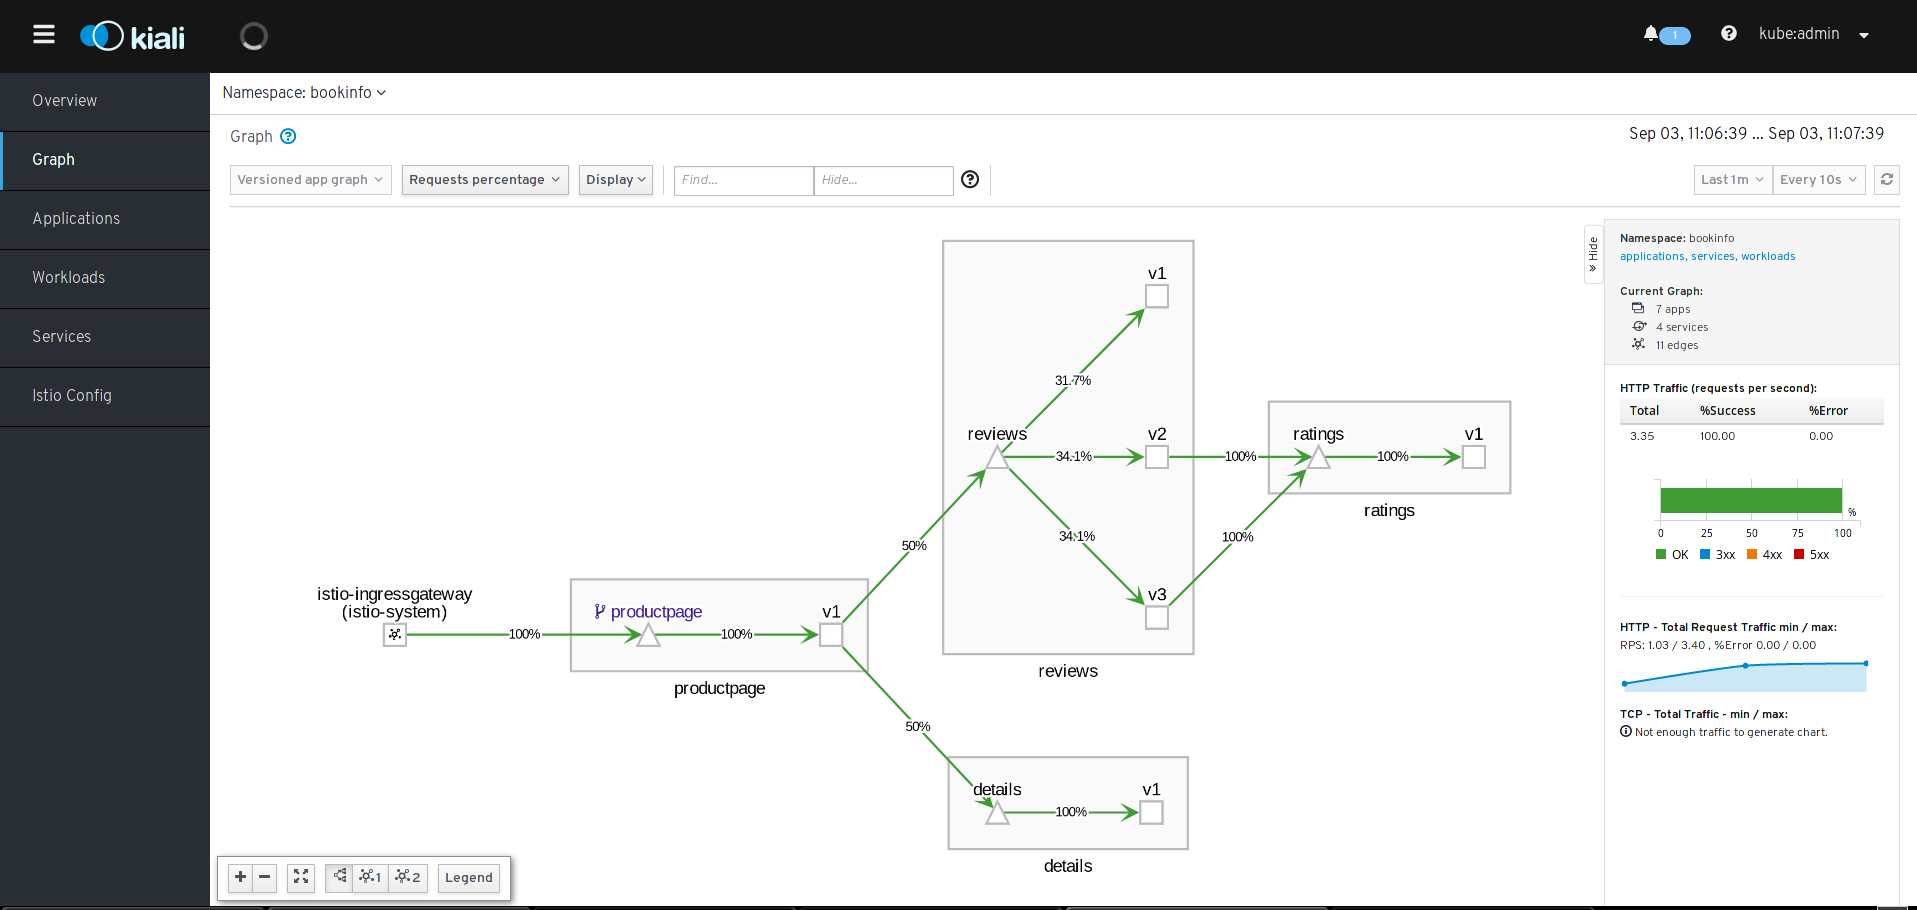
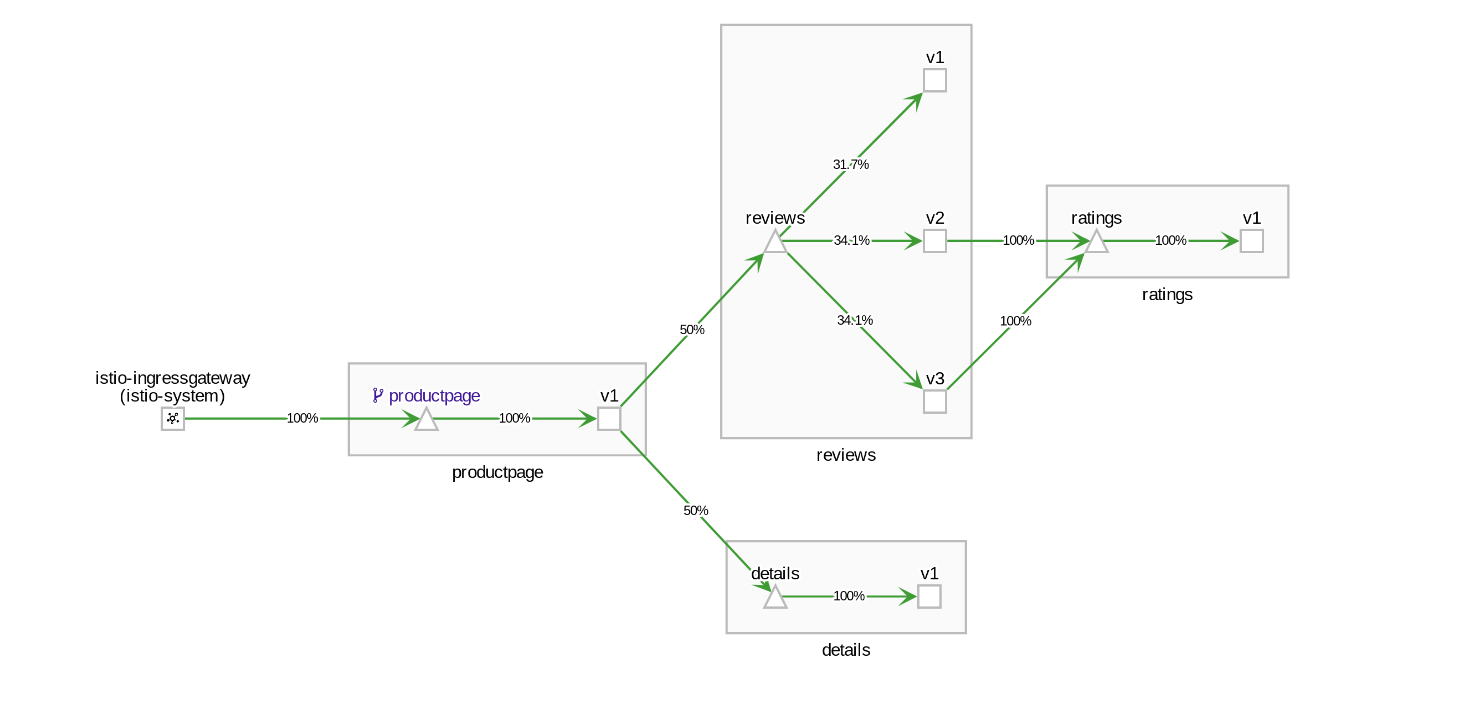
You should now see the application graph showing traffic being created by our
curl requests above. The traffic will flow from the Service Mesh ingress
gateway to the productpage service, reviews service and finally the
ratings service. There will also be another branch from productpage to
details. The request percentage will show 100% on every edge
except for the productpage edge which splits traffic 50% between
reviews and details and the reviews service where the traffic should be split
evenly across all three versions.
Further information
To learn more about Kiali, please see the Kiali documentation at: https://www.kiali.io/documentation/